Dashboard
/ui/management/dashboard is Atlaso's authenticated operations command center. It is a read-only orientation surface:
operators can see current health and follow links into the owning workflow, but the dashboard never applies
configuration, restarts a service, or mutates appliance state.
Interface overview
This verified appliance view provides visual orientation before you begin.
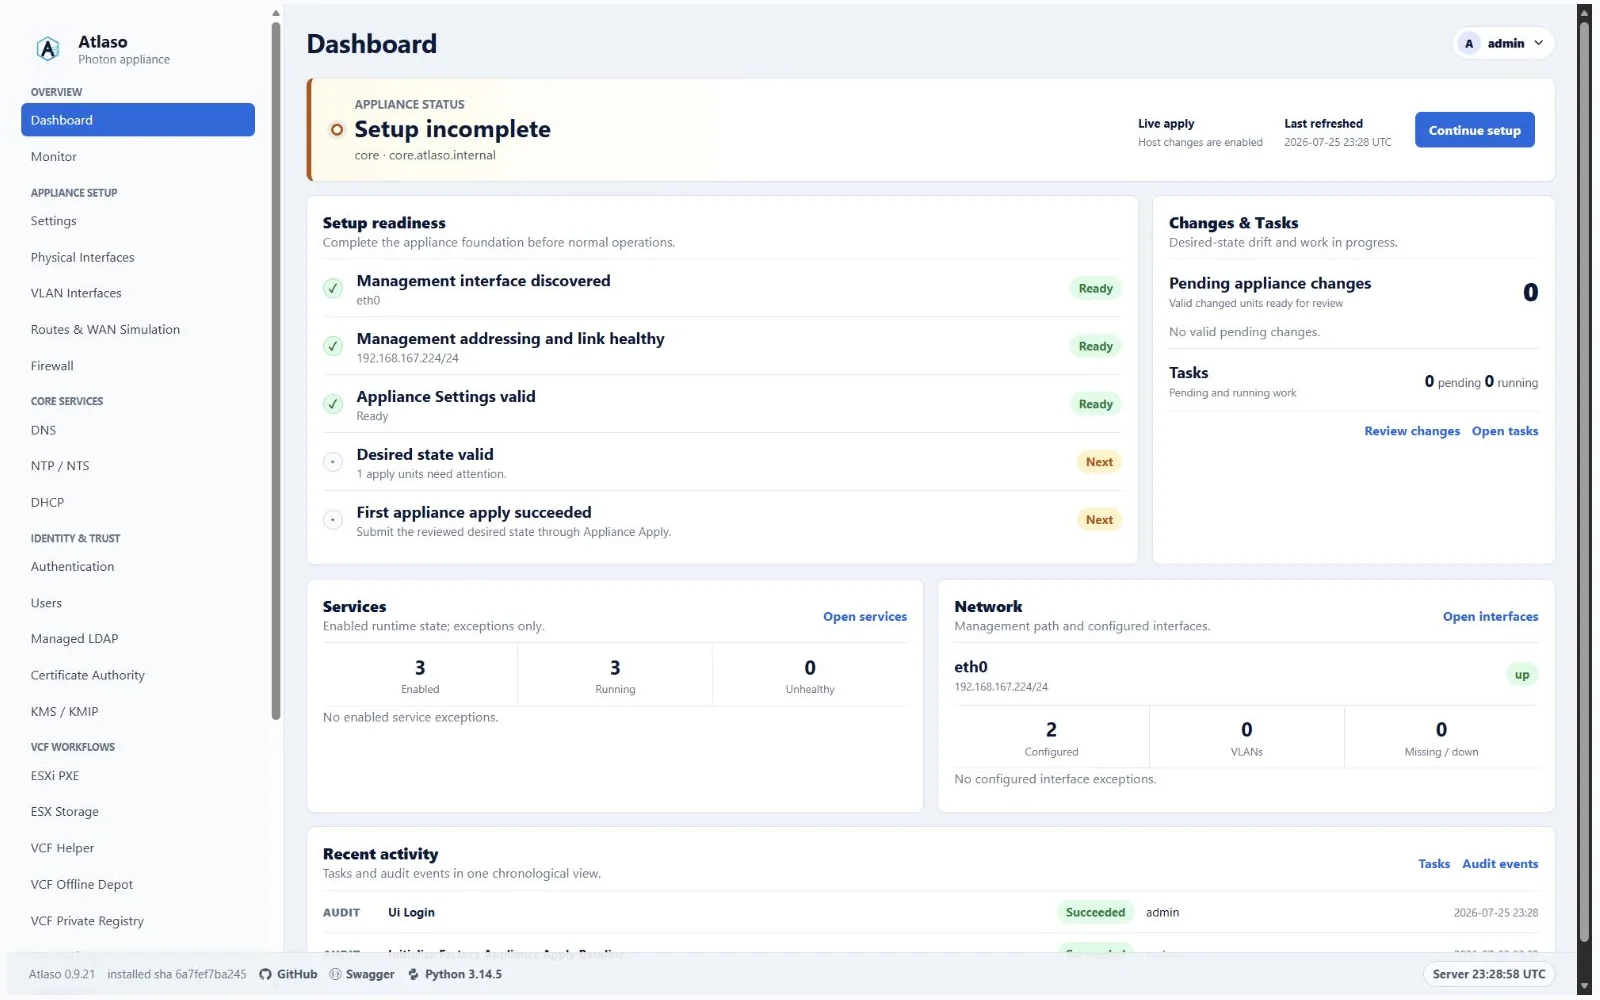
Figure: Dashboard in the verified clean-appliance desktop state.
Overall state
The status band reports one of three states:
Setup incompletewhile management networking is not healthy or no global appliance-apply task has succeeded;Needs attentionwhen setup is complete and an actionable exception exists;Healthywhen setup is complete and no actionable exception exists.
The primary action follows the current state. Setup links to the first incomplete readiness item, attention links to the highest-priority exception, valid pending changes link to Appliance Apply, active work links to Tasks, and an otherwise healthy appliance links to Monitor.
When the factory comparison baseline already matches desired state but no Appliance Apply has succeeded, Continue setup opens the shared appliance-review modal with the complete validated initial desired state selected. Review the components and choose Submit appliance changes to create the first global task. Opening the review remains read-only; nothing changes on the host until that explicit submission.
Readiness and attention
Readiness covers management-interface discovery, management address/link health, Appliance Settings validity, whole desired-state validity, and the first successful global appliance apply. Readiness mode ends only after the management path is healthy and a global appliance-apply task has succeeded.
Actionable exceptions use this fixed priority:
- changed appliance-apply units that fail validation;
- failed tasks created during the last 24 hours, except an appliance-apply failure whose unresolved units were all covered by later successful appliance applies;
- enabled services that are stopped or unhealthy;
- configured physical interfaces that are missing or unexpectedly down.
Valid changed units stay in the separate Changes & Tasks summary. Disabled optional services and interfaces whose
desired role and mode are both unused do not create attention items. A successful apply for unrelated units does not
clear an earlier failure. A resolved appliance-apply failure remains in Tasks, Audit Events, and Recent activity as
history; only its actionable dashboard warning is cleared.
Private snapshot and refresh
The initial page and session-authenticated GET /ui/management/dashboard/data endpoint use the same snapshot builder.
The private response contains generated time, overall state, readiness, attention, pending-change and task summaries,
service and network summaries, and six recent activity rows. Activity rows expose only source, title, outcome, actor,
time, and destination URL. Task results, command output, raw errors, audit detail, and secrets are never dashboard fields.
The browser refreshes every 30 seconds while the page is visible, pauses while hidden, and refreshes immediately after becoming visible. A failed refresh keeps the last successful DOM and displays a stale-data notice.
/api/v1/dashboard remains the existing bearer-authenticated public API and is not backed by this private UI response.
Additional verified states
These captures show responsive layouts and useful operational states referenced by this page.
Dashboard
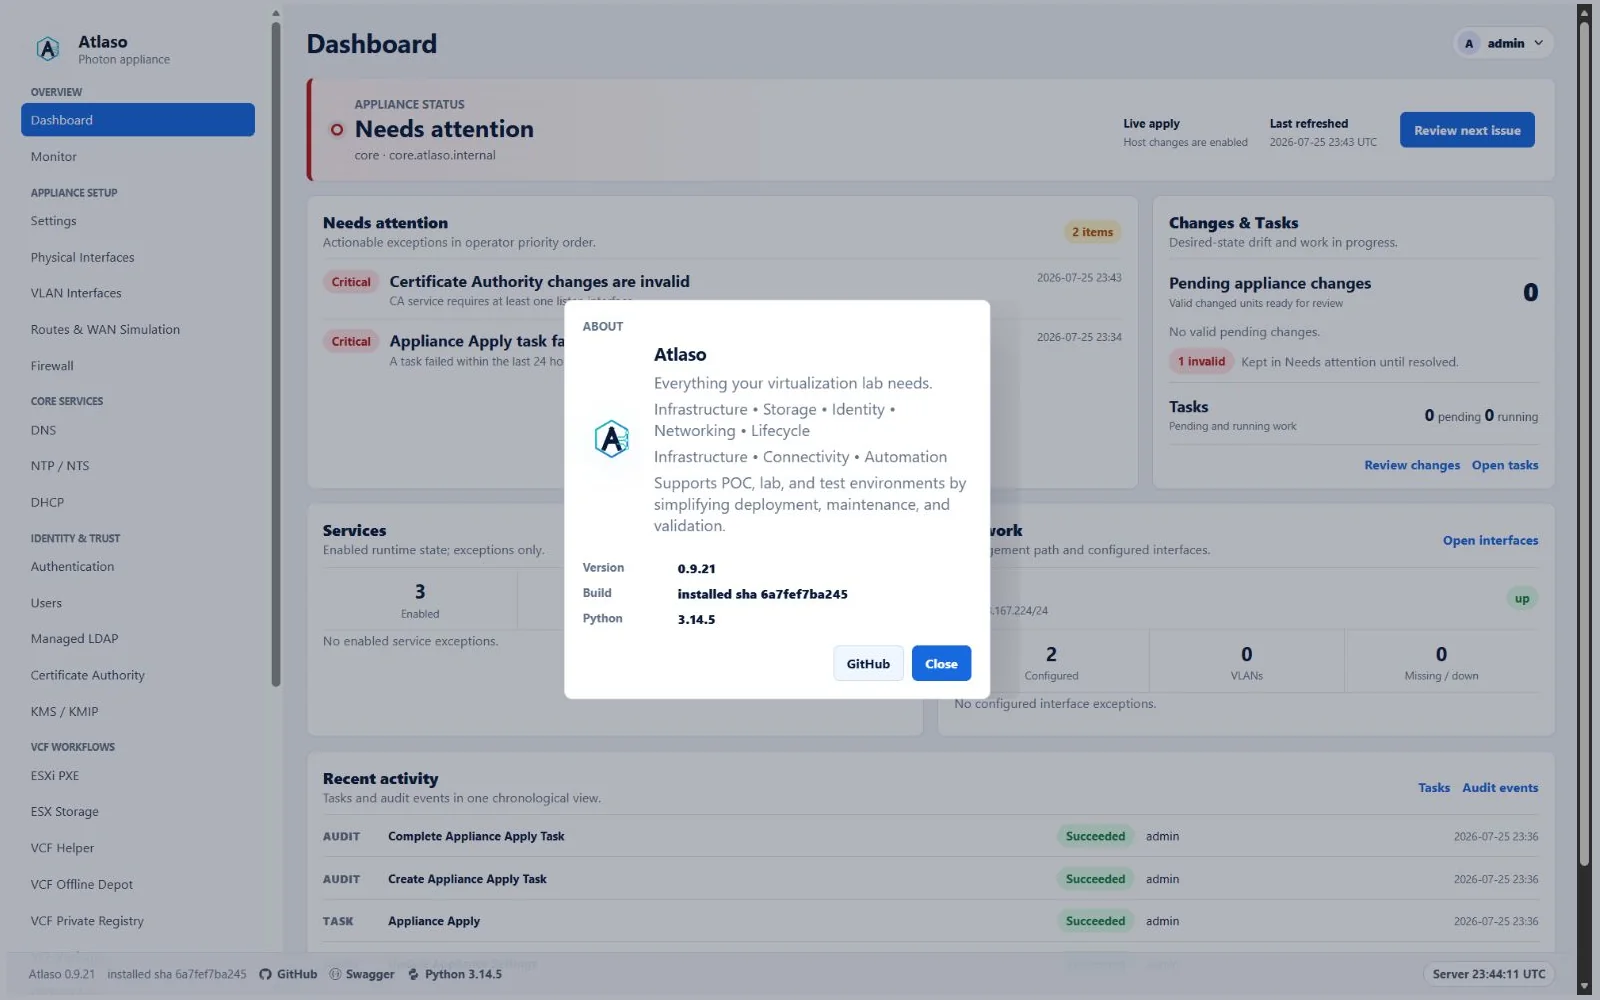
Figure: Atlaso About dialog with the deployed version and build identity.
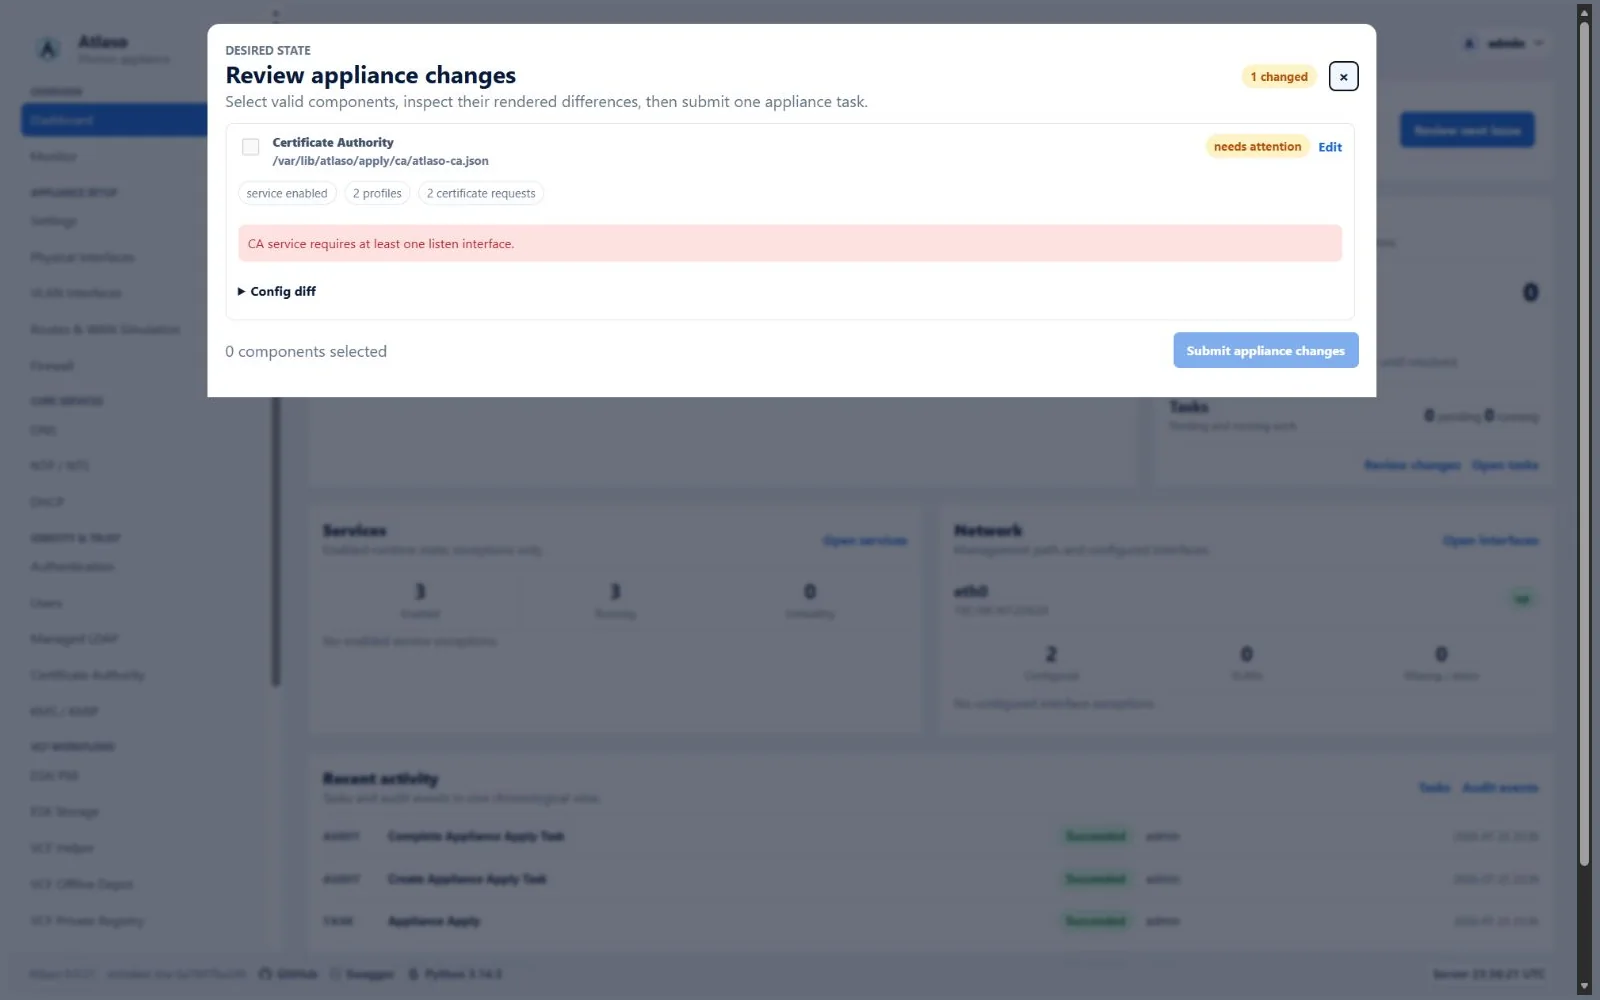
Figure: Dashboard after a successful DNS appliance apply.
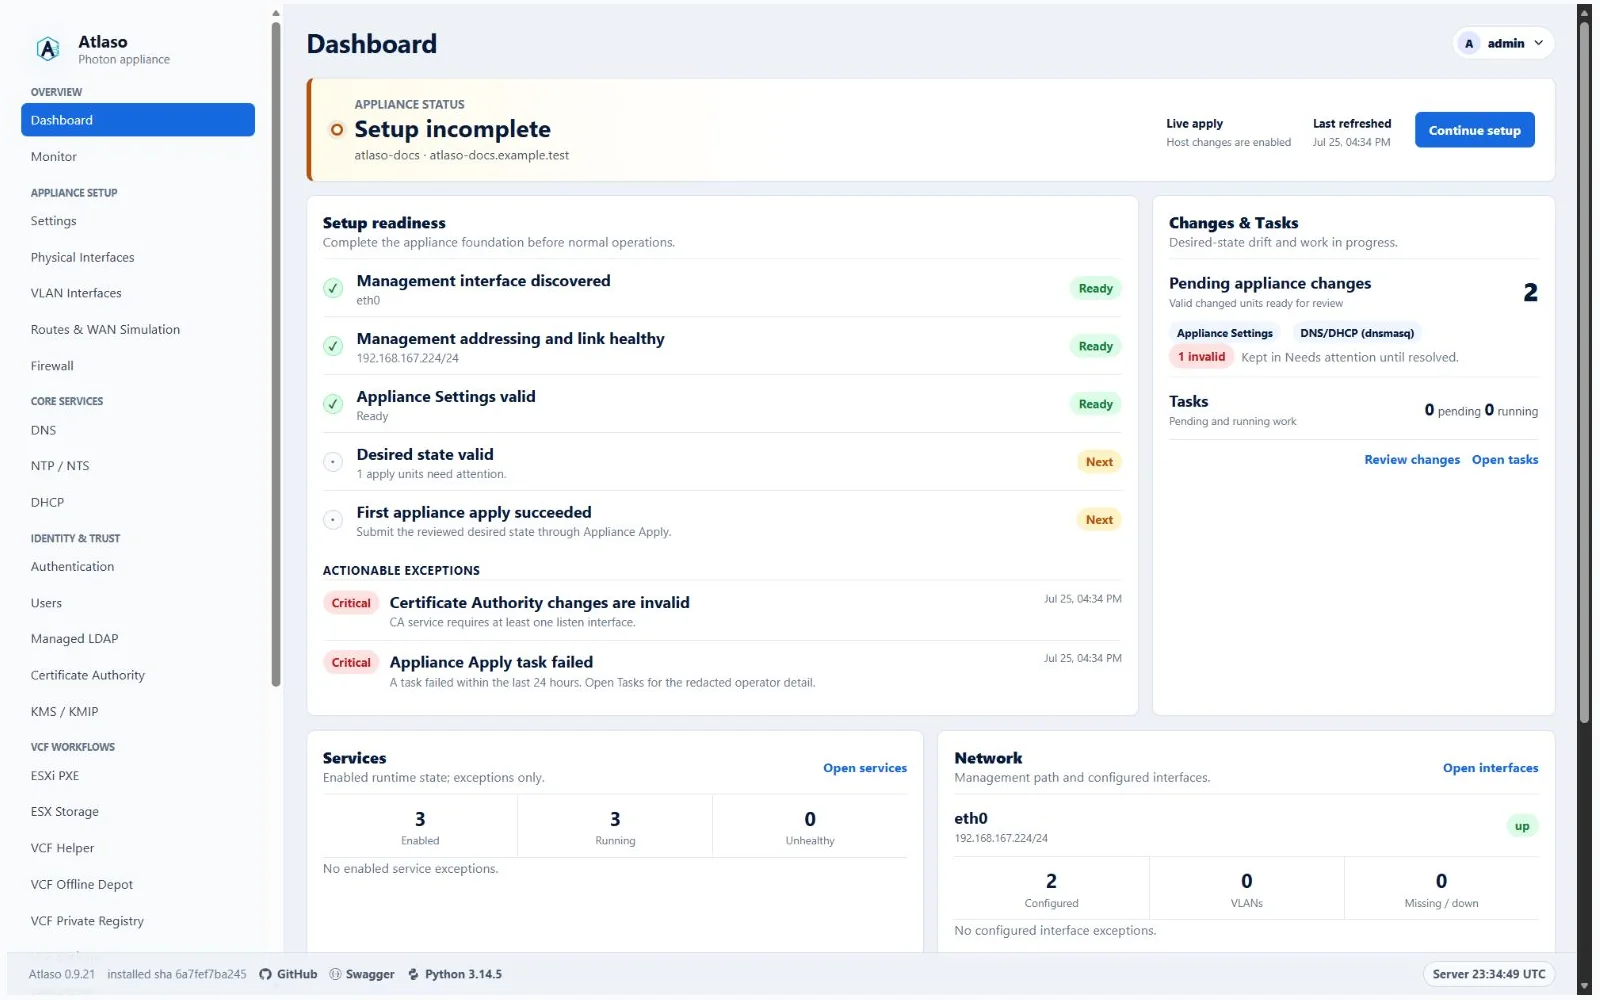
Figure: Dashboard reporting a failed appliance apply task.
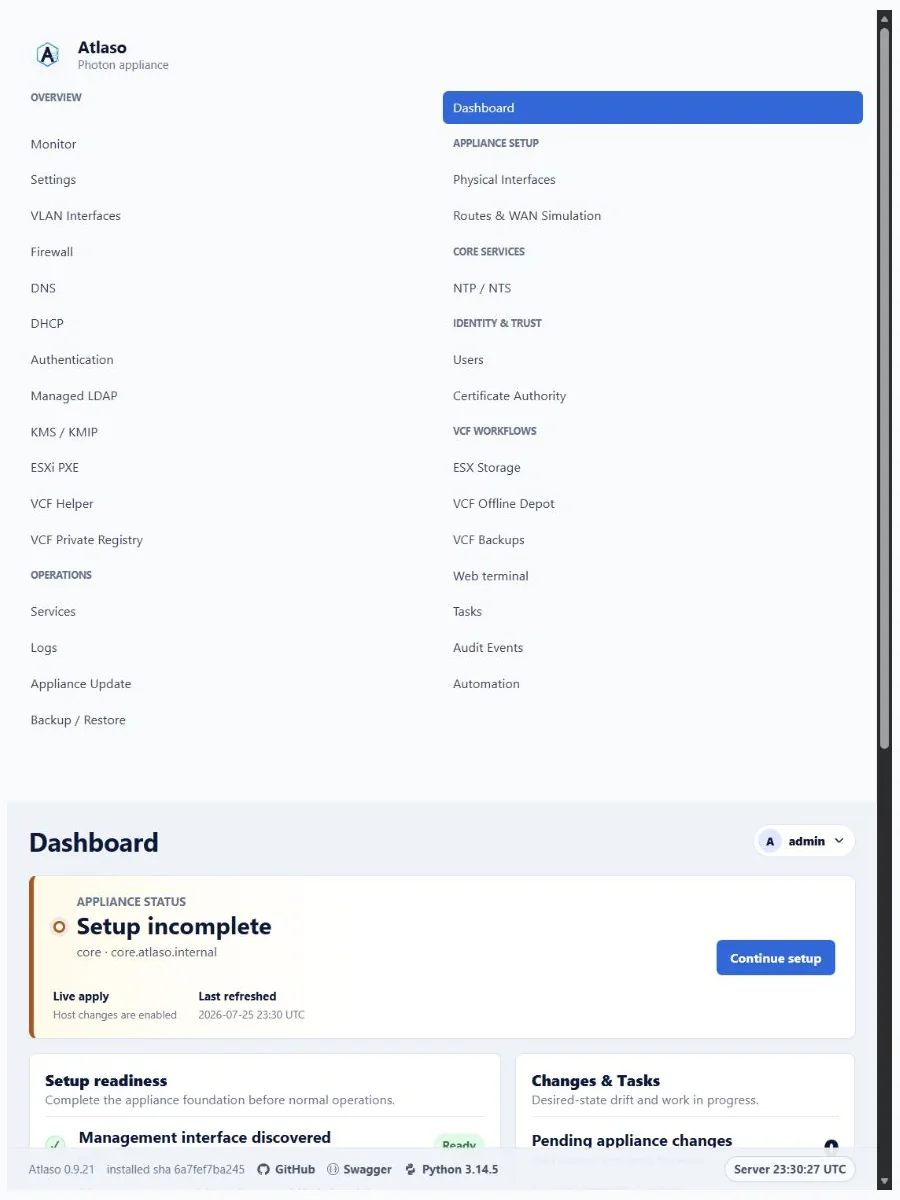
Figure: Dashboard in the verified clean-appliance responsive state.
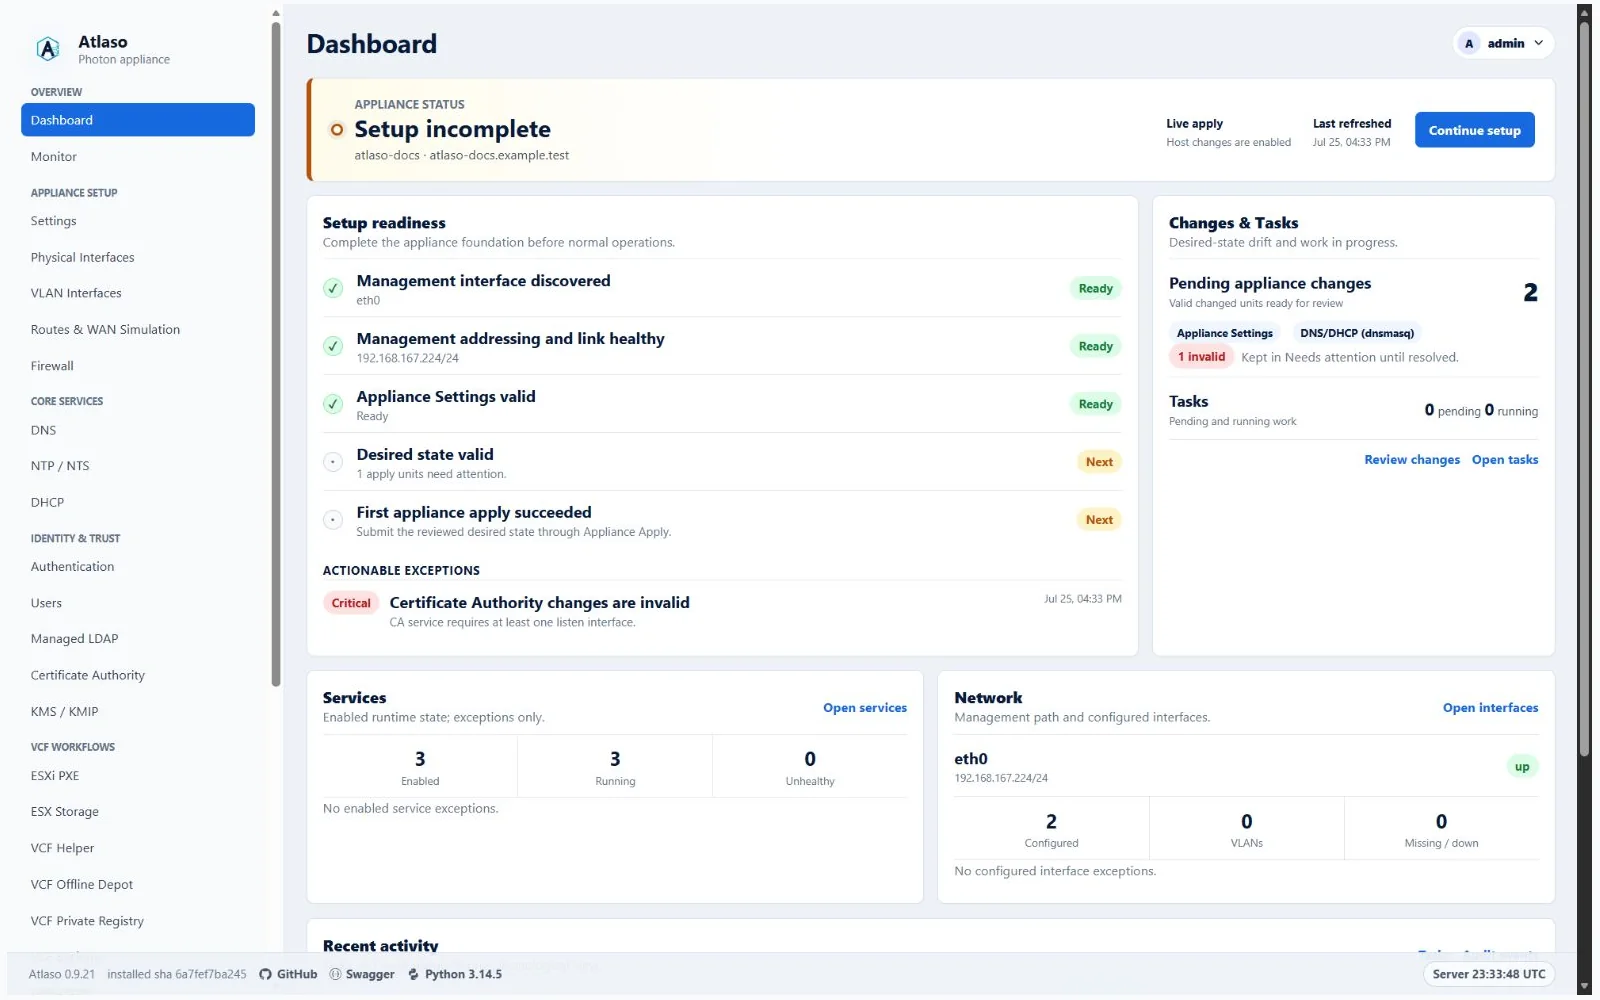
Figure: Dashboard with valid pending changes and a unit needing attention.