Monitor hierarchy and interaction design QA
Reference and capture setup
- Source: historical browser annotation captured from
https://192.168.167.219/monitorbefore the hierarchy changes and before the Disk Usage panel was removed. - Desktop viewport: 1968 × 1562 CSS pixels at the browser's native device density.
- Narrow viewport: 900 × 1200 CSS pixels.
- Historical validation target: VMware appliance
192.168.167.219, deployed with the repository VMware wheel helper. The images below document the preceding layout and interaction work; they are not screenshots of the current panel set. - Current shared cache revision:
monitor-no-disk-usage-20260723-3/atlaso-pwa-v156.
Comparison
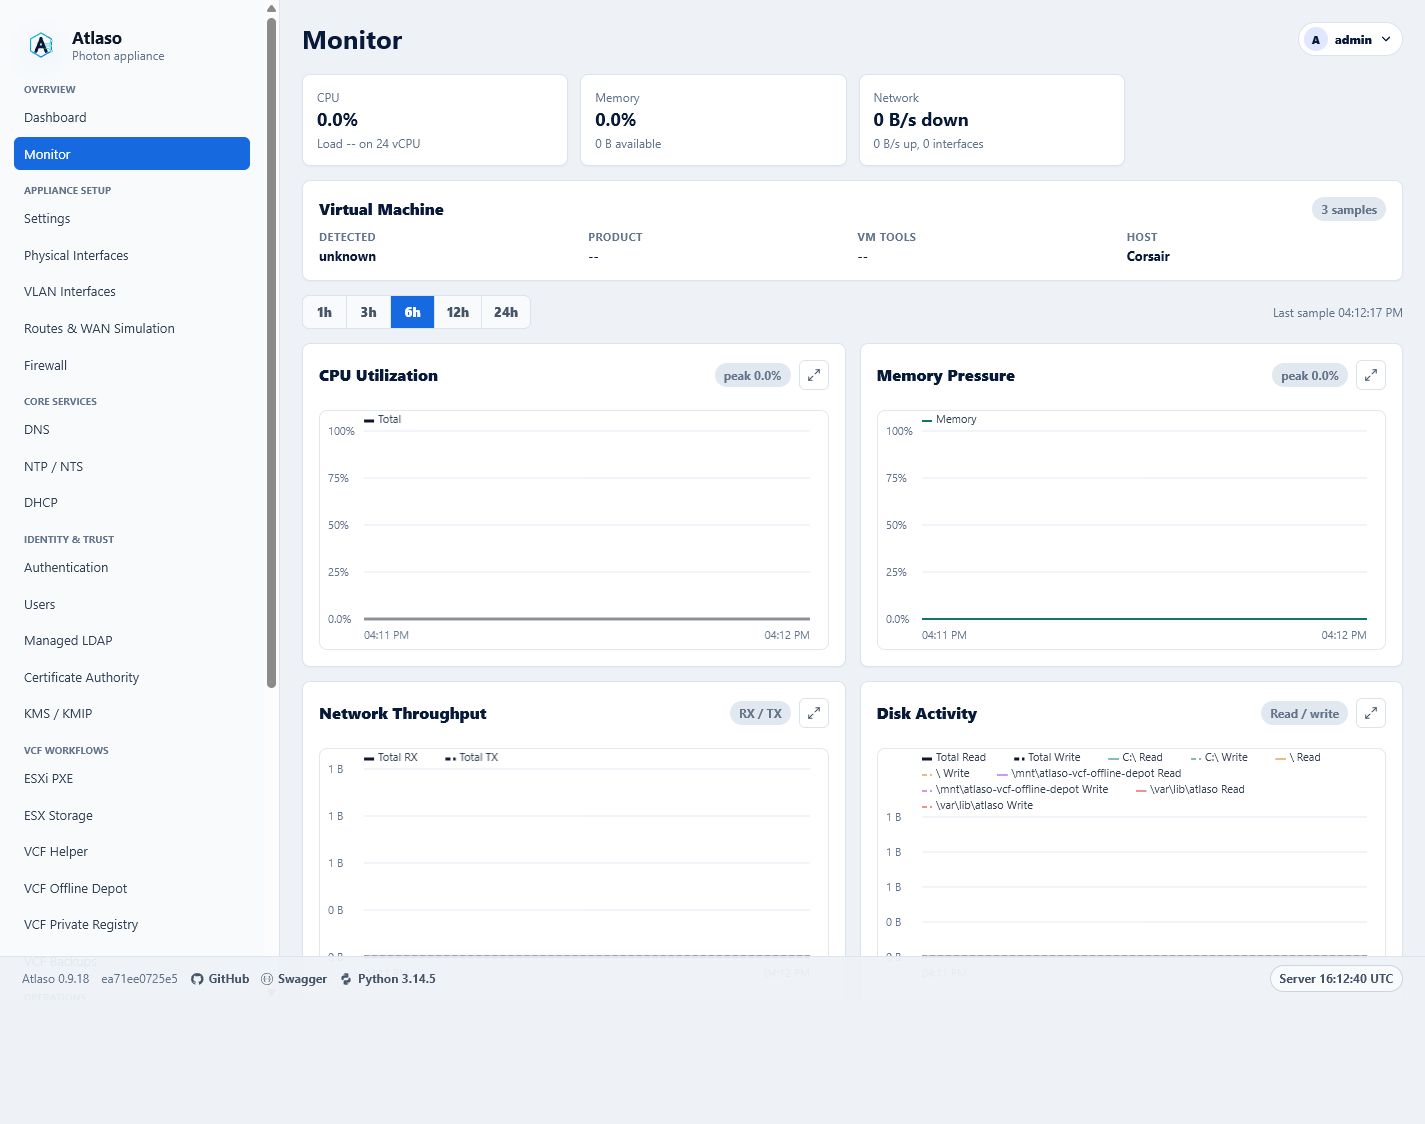
The captured desktop comparison records the earlier hierarchy where Disk Activity owned unique-device I/O and Disk Usage owned capacity. It is retained as historical evidence, not as a representation of the current page. The current Monitor removes the top-level Disks capacity metric, Disk Usage chart, and mount table while retaining Network Throughput and Disk Activity at matching row heights.
Interaction evidence
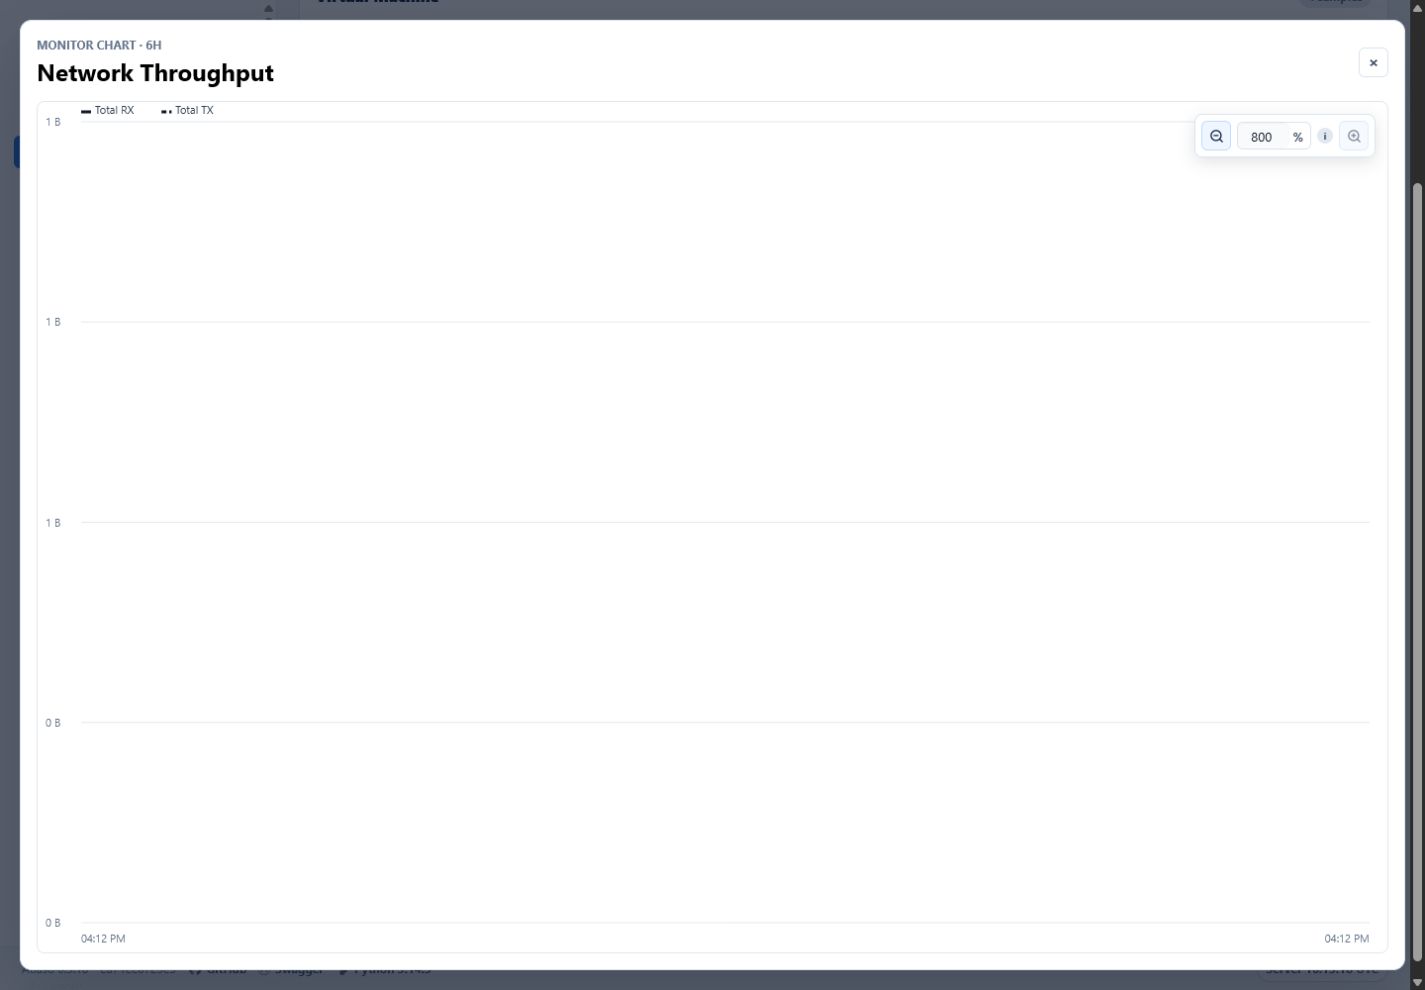
- Full-screen-only zoom uses the in-chart lens controls and editable percentage.
- A tall spike was selected along its line segment, pinned after pointer movement, and cleared from empty chart space.
- Legend selection was exercised live:
Totalselected, a second click cleared it, andcpu0then became selected. - 12h and 24h controls were exercised live; both became active and returned a successful Monitor refresh.
Responsive check
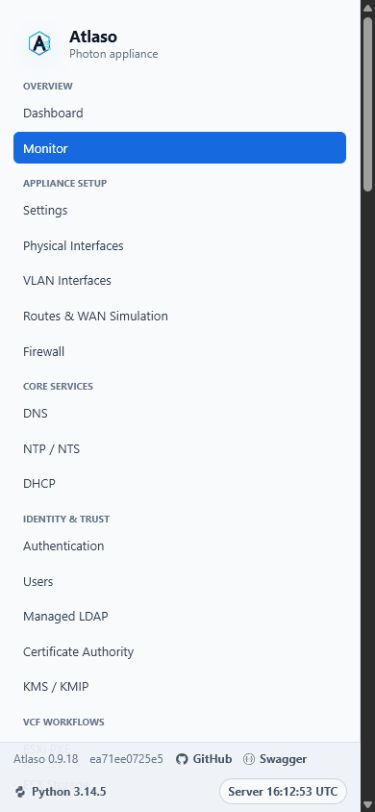
At 900 × 1200 the dashboard returns to natural stacked sizing; full-width controls remain reachable and the desktop two-column card coupling does not force a fixed narrow height.
Review history
- Added total/detail hierarchy and unique-device disk series.
- Split Disk Activity from Disk Usage and restored the per-device I/O table.
- Added full-screen charts, in-chart percentage zoom, and drag-to-select zoom.
- Expanded hit testing from sampled points to complete line segments.
- Equalized Network Throughput and Disk Activity desktop card heights.
- Added clickable legend selection plus 12h and 24h history ranges.
- Removed the top-level Disks capacity metric, Disk Usage chart, and per-mount table after live operator review found capacity presentation not useful on this page.
Final result
The current implementation preserves the useful chart interactions and responsive layout without the removed Disk Usage panel. Filesystem-usage fields remain available to backend samples and API consumers for compatibility; their presence does not imply a Monitor page panel.