Monitor appliance health
Open Monitor for a read-only view of current appliance runtime health. The page reports CPU, memory pressure, network throughput, unique-device disk activity, interface state, and virtual-machine context.
Interface overview
This verified appliance view provides visual orientation before you begin.
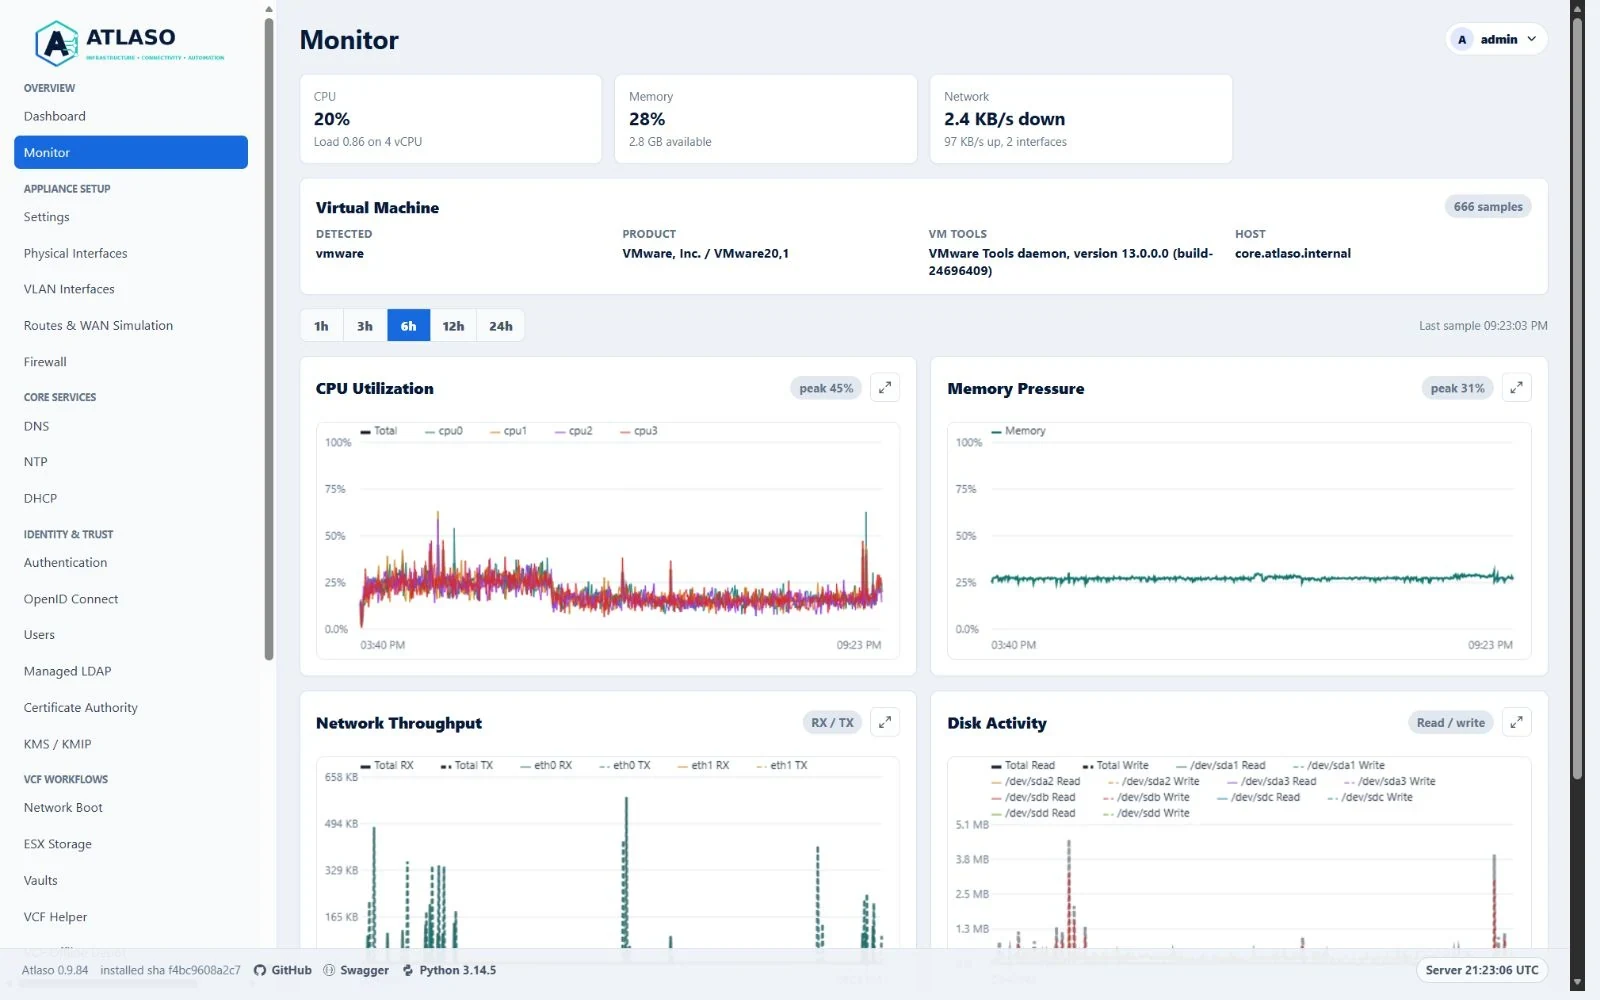
Figure: Monitor summary and live charts in the verified desktop state.
Read the charts
- Start with the appliance totals before expanding per-CPU, per-interface, or per-device series.
- Use the common time-range selector to compare the same interval across charts.
- A range selected during a refresh is loaded next. Rapid changes coalesce to the latest selection, and Atlaso does not render an older range beneath the newly active control.
- Expand a chart when series overlap; full-screen zoom does not change the selected history range.
- Use the read-only interface and device grids below Network Throughput and Disk Activity for the latest per-resource values. Live refresh replaces grid data in place so sorting and scroll context remain stable.
- Treat unexpectedly down configured physical interfaces as actionable. Disabled optional services and unused interfaces are not exceptions.
Filesystem-capacity charts are intentionally not part of this page. Disk activity is counted once per underlying device, even when a filesystem is visible through multiple mount paths. The initial server snapshot also populates the accessible fallback tables when browser scripting is unavailable.
Verify an exception
Compare interface exceptions with Network configuration, service health with the owning service guide, and recent failures with Tasks. Monitor is read-only; make changes through the owning desired-state workflow and use Appliance Apply for enforcement.
Additional verified states
These captures show responsive layouts and useful operational states referenced by this page.
Monitor
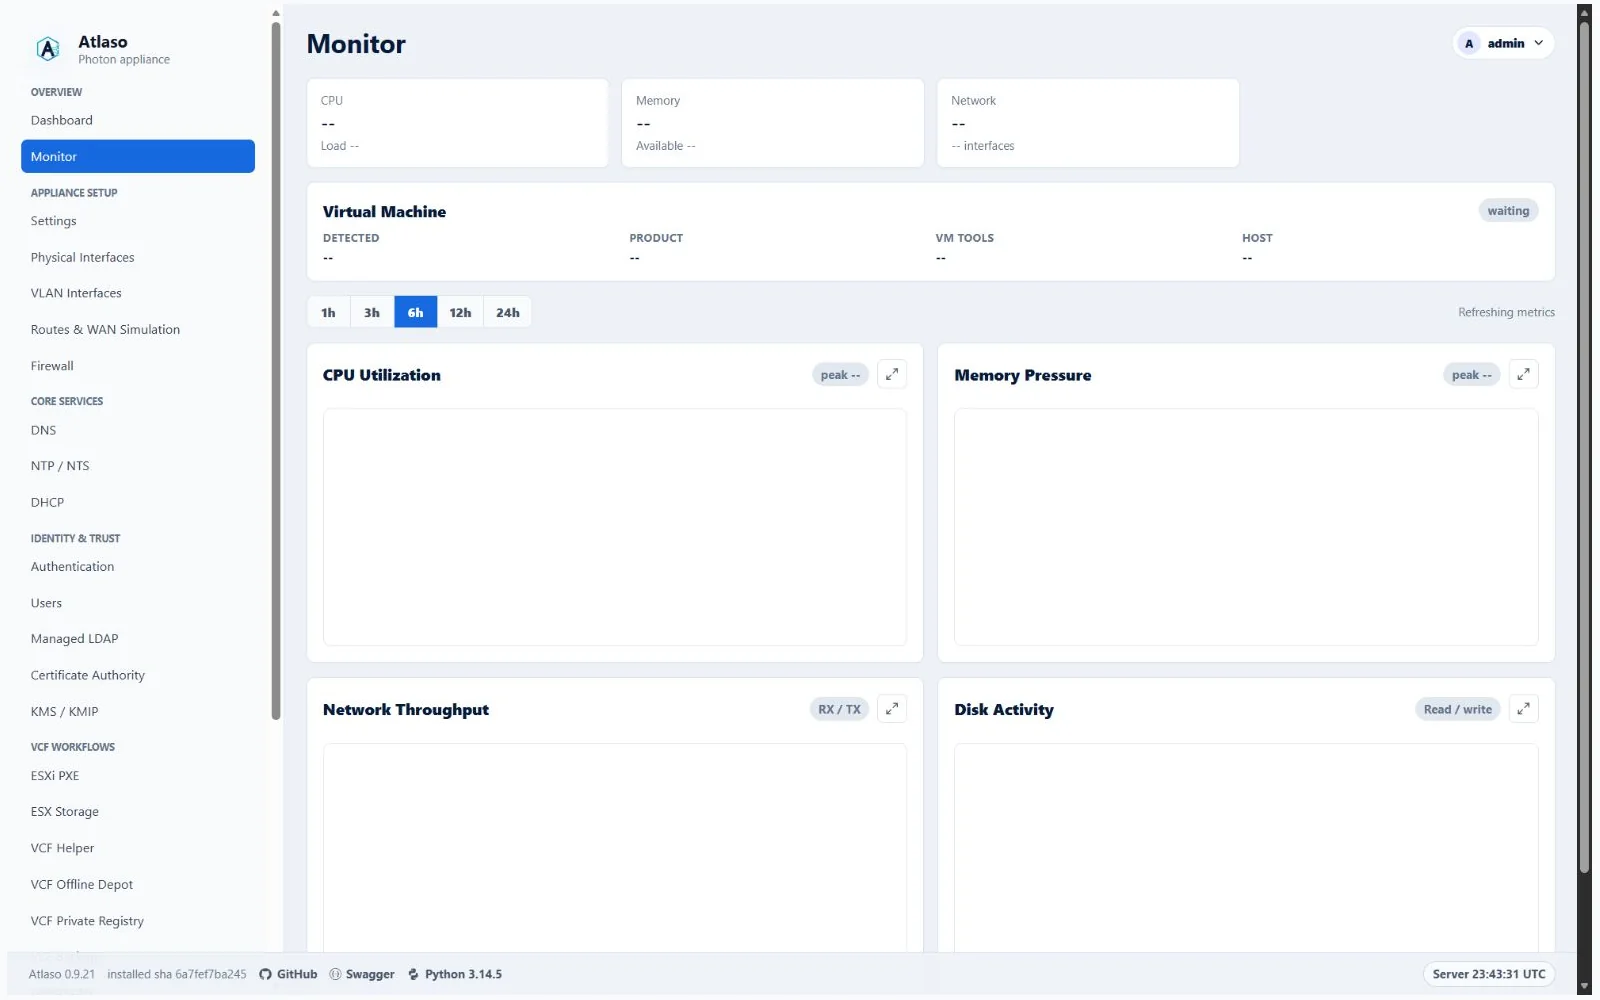
Figure: Runtime monitoring after a successful appliance apply.
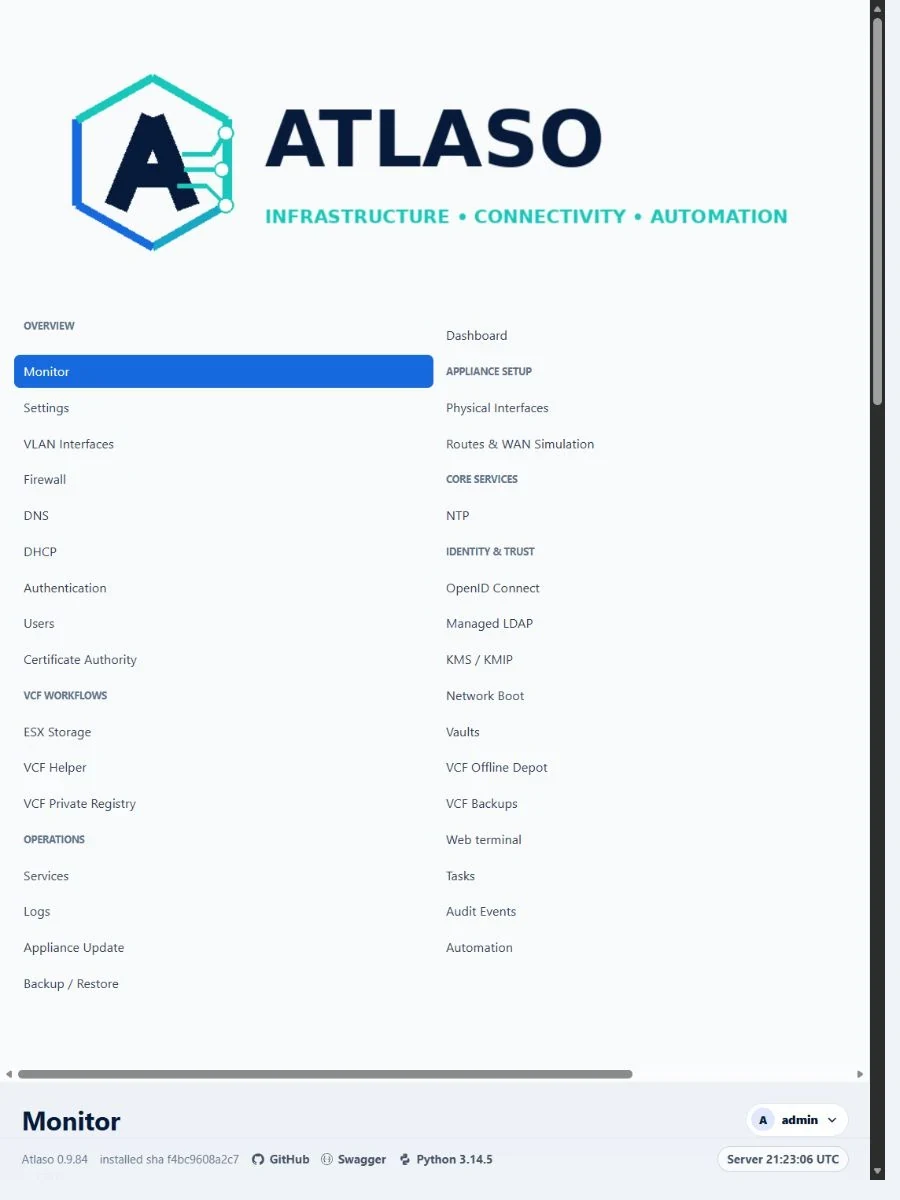
Figure: Monitor summary and live charts in the verified narrow state.
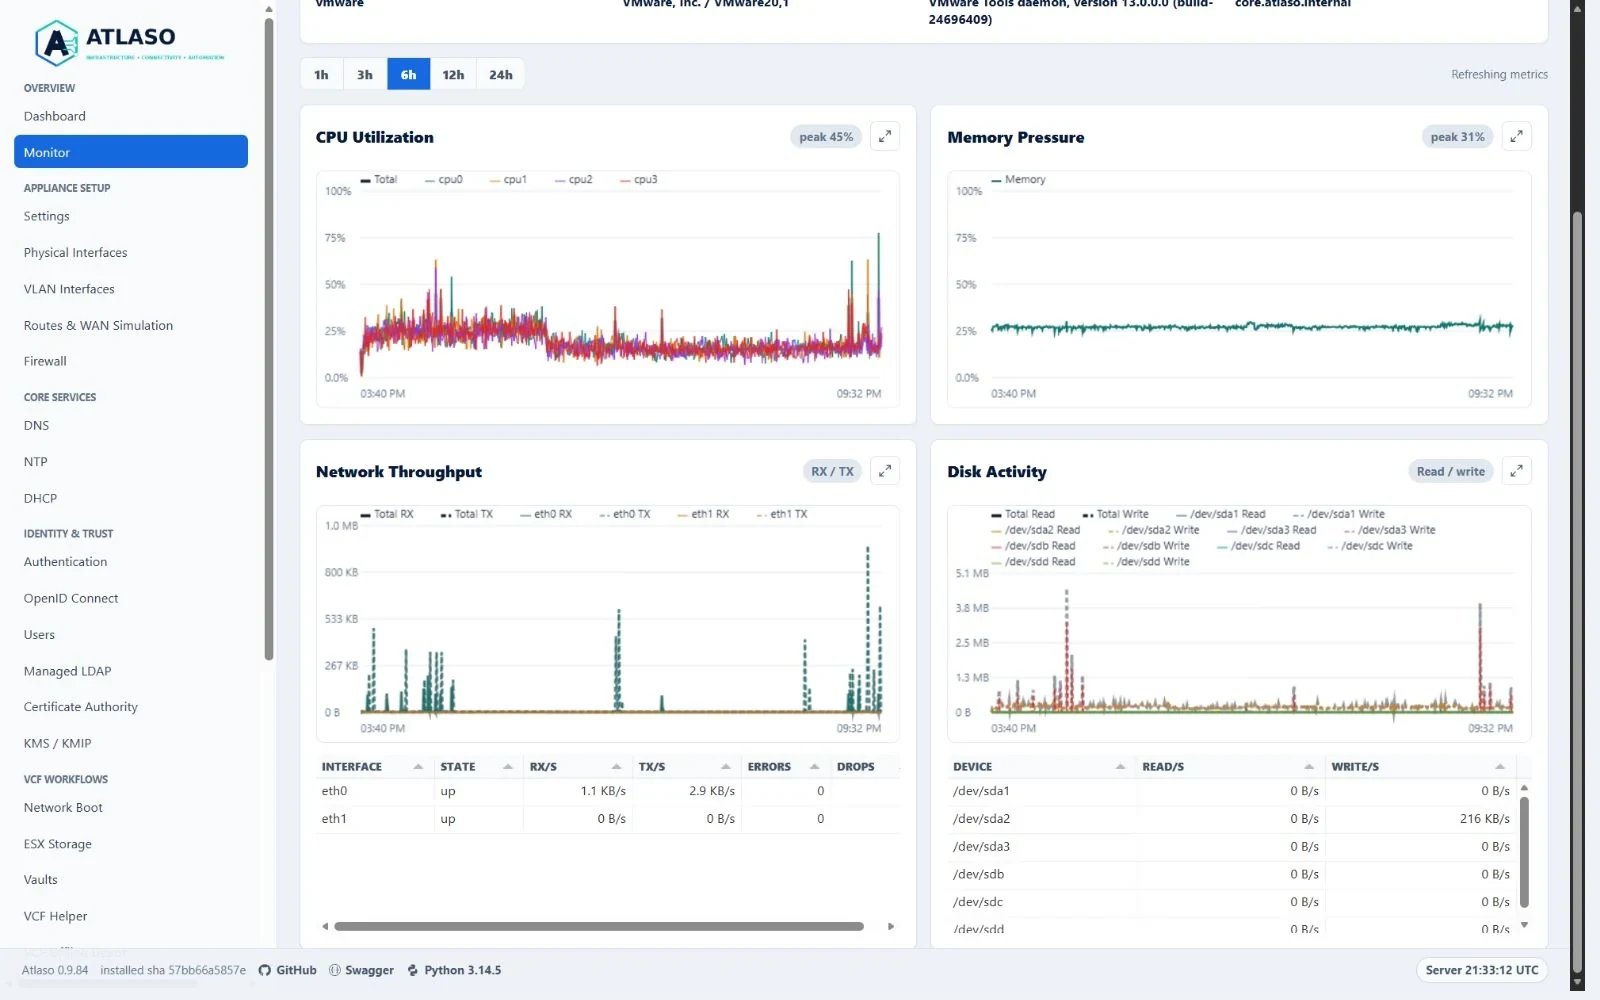
Figure: Network-interface and disk-device activity use read-only grids beneath their live charts.
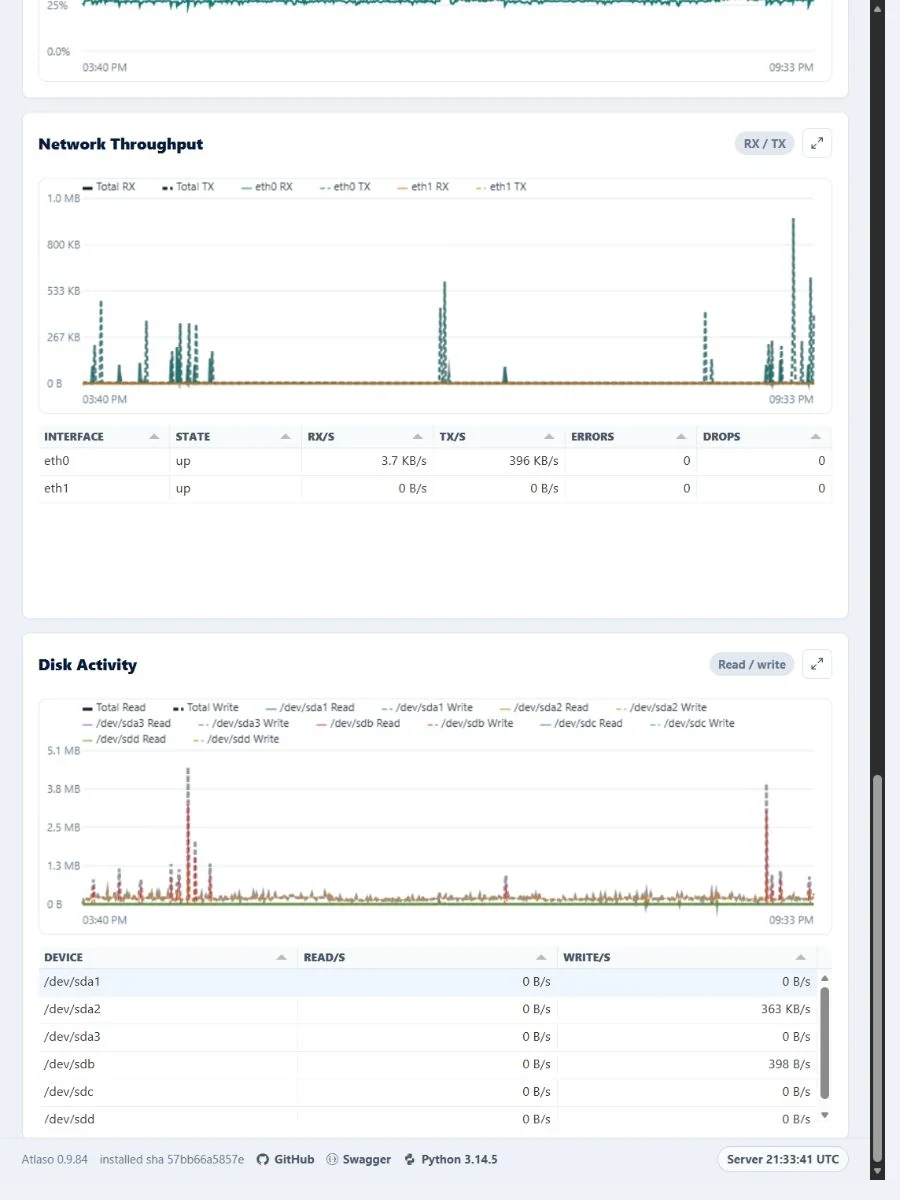
Figure: Network-interface and disk-device grids remain readable without page overflow in the narrow viewport.